How to build and validate 3D-QSAR models - Insights from Xu et al., 2020
A 3D-QSAR model maps aligned molecular fields onto potency. The statistics say whether it predicts. The contours say where a chemist might change the molecule. Both depend on the alignment.
Apr 2, 2023
Data-Driven Chemistry: How Data Science Empowers Drug Discovery
A chemical table becomes a decision only after the row is defined, the model is scored on rows it did not fit, and the next experiment is allowed to disagree.
Feb 9, 2023
Using PaDELPy to Generate Molecular Fingerprints for Machine Learning-Based QSAR
Turn a SMILES table into PaDEL fingerprints and a random forest, then score a held-out split with Matthews correlation. The cross-validation number is computed, not assumed.
Jan 15, 2023
How Long Should Molecular Dynamics Simulations Run? A Practical Guide
Practical ranges for protein–ligand MD, from 50 ns pose checks to microsecond-scale events, and the traces that tell you whether the run has settled.
Nov 24, 2022
How to Perform Data Curation and Classify Bioactivity Data on ChEMBL Database
How a ChEMBL IC50 table for one target becomes a labelled set: one row per molecule, a mean potency, and a class that leaves the uncertain middle out.
Sep 7, 2022
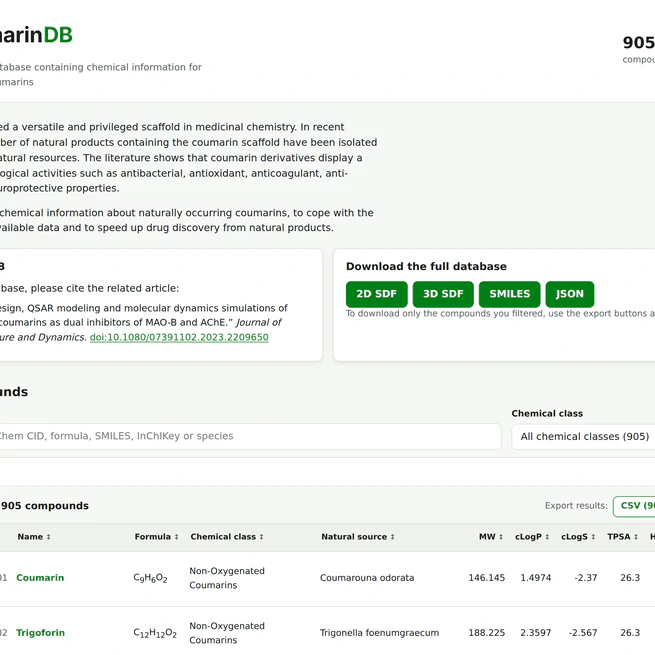
CoumarinDB
A manually curated database of naturally occurring coumarins, compiling chemical structures, physicochemical descriptors, and source organism data to support computational screening and structure-activity studies.
Jan 20, 2022